Even wonder about how to know your organization virtualization infrastructure SLA. We often mentioned 99.999% achieved. But how true is that? It is just a figure that most organization mentioned but how can you justify.
Therefore, I’ve decided to create a dashboard just for the sake of Virtualization Infrastructure. In my lab environment, I got Hyper V cluster, VDI and private cloud. With the help from SCOM and Windows Sharepoint Services, I managed to create my 1st Virtualization Service Level Dashboard.
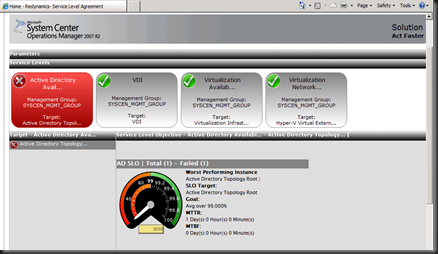
Here is the screenshot of the dashboard:-
I have created SLA for the following components:-
- Active directory
- VDI
- Virtualization Availability
- Virtualization Network
Active Directory is part of the SLA because my entire infrastructure is depend on Active Directory. If one of Active Directory down, then it will impact to the SLA. Based on above figure, this is what you will see when one of the Active Directory server is down. The dashboard for Active Directory is marked as “RED” = problem whereby other component is “GREEN”=Healthy.
The above SLA is monitor based on availability of the monitored components.
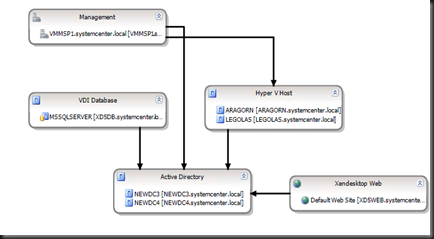
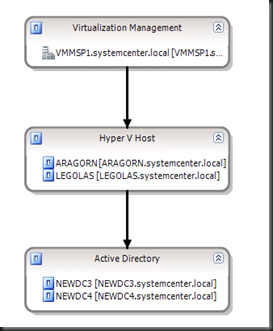
Component such as VDI and Virtualization Infrastructure Availability is monitor based on distributed application which I have created previously document on my blog.
Distribution Application (VDI):-
Distribution Application (Virtualization Infrastructure Availability):-
Meanwhile, Virtualization Network is monitor the availability of Virtual Switch on the environment.
By using SCOM and Windows Sharepoint Services, now I can continue to know my virtualization environment SLA.
Note:-
Above is just a basis sample of the SLA Dashboard. You may come out with a pretty and good SLA Dashboard. Feel free to share so we can create a better SLA dashboard on virtualization infrastructure. Give it a try and let me know your outcome.
Cheers, “Virtual Lai”


